BY JOHN JACKSON MILLER
[Reprinted with permission from Comichron]
With today’s release of December comics orders from Diamond Comic Distributors — and our subsequent analysis and estimates for December 2014 comics sales now posted — Comichron has drawn upon that information to project estimates for the Top Thousand Comics and the Top Thousand Graphic Novels for 2014. Click to see them.
 The tables are on the page just beneath the image links to individual months. As in past years, it is a large page, necessarily, so it may take a bit to load. Also as in the past, I have rounded off estimates to the nearest hundred comics.
Before launching into a discussion of what’s on the list, some more general thoughts on 2014, now that we’ve seen all the data:
• Last winter stank, but it didn’t matter. Headlines for comics sales in January, February, and March 2014 were dire in many places (though not here); the Direct Market was off 4% in the first quarter, overall, or about $5 million. But comics shops made that up in April alone. Across the next three quarters. the market was up 7.1%, or $28 million — allowing the final comics and graphic novel total sale for the year to be up more than 4%, or $23 million to $540.4 million.
It’s a good reminder that not all sales seasons are created equal (especially not as January 2014 had one of its weeks given to December 2013 in the accounting), and that the amount of volume in the market is what matters. It is also a good reminder as we look ahead to the figures for the first part of this year, which will be infused by Star Wars #1‘s blockbuster sales: its effect is likely to be even further amplified given the lower amount of releases to the market in the winter. The addition of a million-copy book to a market that might only see 6 or 7 million copies sold in January could be quite significant.
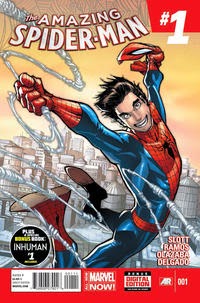
• 2014 was not the year of the blockbuster — despite a new record-setting comic book. As noted further below, Amazing Spider-Man #1 from April broke all sales records from the last fifteen years — but it was largely an outlier, as six months out of twelve the top-seller for the month was the book that leads the list when no blockbusters are around: Batman. (Not that Batman’s sales haven’t been blockbuster some months in the past, just that it is the typical industry leader in non-event months.) This seems to have played out in the charts in general, as we see in the Top Thousand and the larger indexes that the upper tier books didn’t carry as much weight this year, even as comics sales overall grew.
Here’s some visible evidence of the shape of the market, as seen on the lists. We find the following breakdowns for unit sales:
AT LEAST THIS MANY COPIES DURING YEAR
| 200,000+ | 100,000+ | 75,000+ | 50,000+ | 25,000+ | 10,000+ | |
| 2009 | 2 | 39 | 119 | 379 | n.a. | n.a. |
| 2010 | 0 | 26 | 94 | 303 | 955 | n.a. |
| 2011 | 3 | 42 | 86 | 343 | 984 | n.a. |
| 2012 | 5 | 63 | 129 | 403 | 1100 | 2250 |
| 2013 | 6 | 64 | 178 | 390 | 1128 | 2430 |
| 2014 | 4 | 40 | 108 | 401 | 1195 | 2353 |
As you can see, the upper tiers, above 75,000 copies, fell off dramatically from 2013 to 2014. But the next tiers bulked up. The best guess is that about 3,800 comics sold at least 5,000 copies — which makes sense, considering that’s about where the 300th place cutoff is each month these days.
Now to that list. The Top Thousand Comics account for around 52.07 million copies; that’s well over half of all the comics that Diamond sold. The figure is down from 54.21 million copies in 2013, though Diamond’s unit sales of comics overall were up 0.25%. In 2012 the figure was 53.43 million copies; in 2011, it was 47 million copies, and in 2010, the total was 45.3 million copies.
Using our database to project sales for other issues, it appears that the Top 2,500 Comics for the year sold around 78 million copies, down from 79 million in 2013. So the farther down the list we go, the more the unit sales picture improves.
In full retail dollars, the Top Thousand Comics sold for $201.03 million, a $1 million drop from last year’s total of $202.02 million. (See the 2013 article here and charts here.) Again, since Diamond’s dollar sales for comics were up 4%, it’s clear that the highest-selling comics were not where the growth was last year — but rather, the titles selling fewer than 25,000 copies each. And it’s growth from 2012’s figure, which was $191.4 million. (See the 2012 article here and charts here.)
Doing the same estimating for the Top 2,500 Comics puts 2014 ahead of 2013, $294 million versus $288 million.
Once again this year, almost every single one of the Top 100 comics on the list had a “multiple order codes” notation from Diamond, meaning there were variant covers or reprints combined to make the main entry.
The Top Thousand Graphic Novels, led by Saga Vol. 3, went for $81.19 million, up from $79.03 million in 2013, from $71.4 million in 2012, and from $58.4 million in 2011. Combined, the Top Thousand Comics and Top Thousand Graphic Novel lists account for about 52% of the orders by dollars Diamond received in publishing last year, which was around $540 million. That percentage is down from 54% in 2013 and 55% in 2012. Again, the best-selling books are accounting for less and less, even as the pie grows larger.
TOP COMICS OF THE YEAR, DECADE, AND CENTURY
The renumbered Amazing Spider-Man #1 was the top seller of the year; Comichron estimates that, all told, around 559,200 copies of the issue, including all variants, were ordered by Direct Market retailers in North America. That’s enough to make it the highest-selling comic book of the 21st Century through the end of 2014; Marvel’s Star Wars #1, released last week, will easily surpass it, but we won’t see it on the list until Diamond releases its 2015 end-of-year data next year.
So it will be a short reign for the Spider-Man issue atop the list — less than a year. The issue takes the spot held for five years by the Obama Amazing Spider-Man #583, with orders of 530,500 copies in 2009. You can see the updated top-sellers by year here.
The entire Top Comics of the 21st Century list has been updated, and it has been split into lists for thedecade of 2000-2009 and the decade of the 2010s. One more comic book from 2014, Walking Dead#132, cracked the Top 10 for the Century, landing at #8. It’s the third year in a row an issue from the series has broken into the list, but this one comes with a dagger in our charts, noting that most of its sales came from a single gigantic purchase by the repackager Loot Crate. While the copies were sold by Diamond and can’t be separated out, it is worth some kind of footnote so readers in future years will know why this one issue ranked the way it did.
The Top 10 since 2000, up to 2014:
| Comic-book Title | Issue | Ship | Price | Publisher | Est. sales | |
| 1 | Amazing Spider-Man (new series) | 1 | Apr-14 | $5.99 | Marvel | 559,200 |
| 2 | Amazing Spider-Man | 583 | Jan-09 | $3.99 | Marvel | 530,500 |
| 3 | Walking Dead (including Chromium edition) | 100 | Jul-12 | $3.99 | Image | 384,800 |
| 4 | Civil War | 2 | Jun-06 | $2.99 | Marvel | 341,900 |
| 5 | Civil War | 3 | Jul-06 | $2.99 | Marvel | 337,000 |
| 6 | Walking Dead | 115 | Oct-13 | $2.99 | Image | 329,300 |
| 7 | Civil War | 1 | Feb-13 | $3.99 | Marvel | 328,500 |
| 8 | Walking Dead† | 132 | Oct-14 | $2.99 | Image | 326,300 |
| 9 | Justice League of America | 1 | Feb-13 | $3.99 | DC | 326,000 |
| 10 | Captain America | 25 | Mar-07 | $3.99 | Marvel | 317,700 |
Uncanny Avengers #1 and Civil War #4 were bumped from the Top 10.
Fourteen issues from 2014 made the Top 300 for the 21st Century list, once again fewer than last year. Five 2014 issues made the Top 100, and four made the Top 50.
THE PUBLISHERS
Who published the Top Thousand Comics this year? Here’s the breakdown:
Archie: 4 (+3 from 2013)
Titan: 3 (+3 from 2013)
IDW: 1 (-14 from 2013)
Valiant: 1 (unchanged from 2013)
That’s a pretty short list, with Aspen and Boom dropping out. Titan made the list, thanks to Doctor Who. Marvel picked up a bunch, while the biggest drop-off belonged to IDW, mostly for the reason that My Little Pony isn’t as high on the charts as it was in 2013.
And here’s the publisher breakdown of the Top Thousand Graphic Novels. Those with 10 or more entries:
Viz: 17 (+1 from 2013)
Oni: 10 (+1 from 2013)
Marvel’s loss is almost the size of DC’s gain, and Image picked up a lot. Random House and Boom also made headway into the list.
Walking Dead softcovers and hardcovers in the Top 2,500 added up to more than $6.5 million at retail — with comics bringing the total for the line up to nearly $10.8 million. That’s enough to give it a market share of exactly 2%, which would make it once again the seventh largest publisher for the year, after Dynamitewere it a separate firm.
COVER PRICES
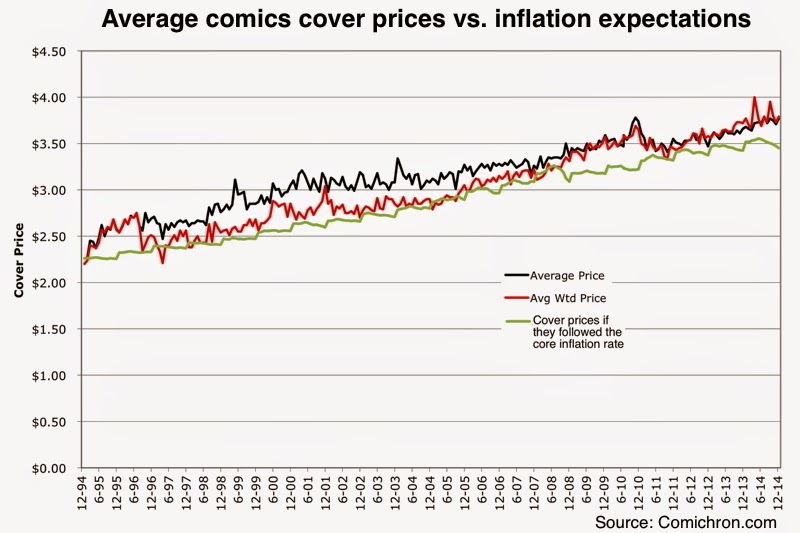
Since comics are linked to prices to other goods and services — like paper and ink, and what it costs to hire talent — it’s not too surprising that the average prices tend to have been a bit higher. And we can see that there have been times in which prices have increased faster than others: particularly 2008-2010, when major publishers tried to go from $2.99 to $3.99 in defiance of the general recession the rest of the economy was suffering. Comics publishers pulled back on price increases at that point. But generally, we might expect that a $2.25 comic book in 1994 ought to cost about $3.50 now — which it might if most publishers didn’t eschew half-dollar increments. We’re not far off of that.
To a degree, some of the perception of high comics prices comes from a lack of collective memory about what comics used to cost: look back on monthly changes over time and annual median prices since 1961 here. And the track of the green line above would be different depending on what year it started in: 1994 was a year in which paper supply was in great demand, and so that $2.25 baseline could already have been high. But there generally haven’t been many wild departures from inflation in the general economy in the last 20 years.
Repeating the end-of-year report, the comic shop market in North America ordered more than $540 million worth of comics and graphic novels in 2014, an increase of 4% over 2013. The final end-of-year report, bringing in outside channels and digital, will appear later this year. You can look back on the 2013 Overall charts here.
There are 23 other years of Diamond annual reports on the site, going back to 1991. You can also find comparatives for how the market as a whole did across that time by viewing our Yearly Comics Salespage.
 John Jackson Miller has tracked the comics industry for more than 20 years, including a decade editing the industry’s retail trade magazine; he is the author of several guides to comics, as well as more than a hundred comic books for various franchises. He is the author of several novels including Star Wars: Kenobi, Star Wars: A New Dawn, and the upcoming Star Trek: The Next Generation – Takedown, releasing January 27. Visit his fiction site athttp://www.farawaypress.com.


Thanks for the usual standout job in presenting the numbers in a usable form.
I assume #46 on the GN chart, Minecraft Official Mojang Essential Handbook HC from Scholastic, with 10711 sales, is some sort of categorization error, since it never made the monthly Top 300 chart.
Putting that one aside, it looks like the top book which never made the monthly Top 300 was #288, Aquaman Vol. 2 The Others, selling 4101 copies. The theoretical maximum a book could sell and never make the Top 300 was 5051, so that Aquaman book must have been just bubbling under almost every month. In all it looks like about 145 books made the Top 1000 for the year without ever making the monthly chart. On the other end of the spectrum, 33 books made the Top 300 every single month of 2014.
Looking forward to playing with the numbers in some more detail, especially after we see the Bookscan charts.
The Essential Mojang Construction Handbook was #1 on the November Books chart from Diamond. Not sure why they shifted it over to the TPB/GN chart. There have been other Minecraft books from the line in the TPB list, that I can see.
Given where Volumes 1 and 3 landed, that second Aquaman book seems about right — it would be a regular stock item for an ongoing series, just new enough that the figures would be all right but not huge. I’ll avoid the “Aquaman bubbling under” joke. (Whoops, guess I didn’t.)
Specific publishers interests notwithstanding, is it good or bad that an iconic comic character, Batman, perpetually rules the roost unchallenged? I mean, would it be a better indication for the health of the industry if he’s constantly having to fight Spiderman for the spot? Or he or they are getting serious competition from pop-culture non-tight TWD or To pick another example, Lumberjanes?
Or is it as simple as things are good when everyone continues to like Batman?
Silly but True
Since so much of the market is dependent on pull-and-hold subscriptions, I would wager that Batman simply has a larger regular customer base in that department — which keeps it relatively stable.
There’s always been that one title that leads the list so long as nothing else is shaking up the charts: Batman took that position over after Jim Lee was added to the title in the early 2000s, but before that, it was Uncanny X-Men for two decades. And, yes, as you describe, when nothing challenges the always-leading title, that’s a sign not much is going on in the business. Uncanny X-Men was the #1 book 11 months out of 12 in 1998, and that year was dead, dead, dead.
I don’t think we want a situation where there is no reliable market leader, but definitely variety at the top tends to correlate with a market that’s hitting on all cylinders.
John,
Thanks for the perspective.
Silly but True
Comments are closed.