 Diamond just released the top ten and market share reports for October and added comparative — month-to-month and year-to-year — charts for the first time. Paging Paul and Marc! The comparisons are not comforting but actually show graphic novel sales up 13 percent from a year ago. SUPERMAN: EARTH ONE was a big hit, and The Walking Dead Effect is supplanting the Watchmen and Scott Pilgrim effects.
Overall comic and graphic novel sales in October declined by 9.20% from September, but were up 2.77% over October 2009’s sales, with graphic novel sales up a full 13.04% over one year ago. Compared to the same period in 2009, year-to-date comic book and graphic novel sales have declined 4.74%.
Marvel led DC in units and dollars once again, and perhaps most notably — the #1 comic this month is by Rick Remender and Jerome Opeña — hardly household names but maybe they should be.
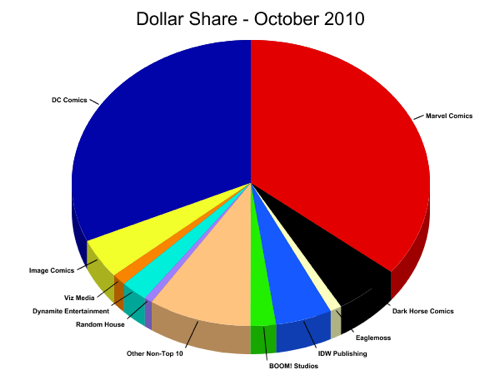
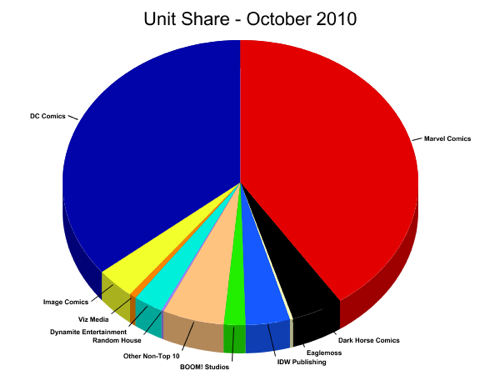
TOP COMIC BOOK PUBLISHERS
|
PUBLISHER |
DOLLAR SHARE |
UNIT SHARE |
|
MARVEL COMICS |
35.70% |
40.56% |
|
DC COMICS |
31.67% |
35.81% |
|
DARK HORSE COMICS |
5.92% |
4.67% |
|
IDW PUBLISHING |
5.09% |
4.04% |
|
IMAGE COMICS |
4.52% |
3.54% |
|
DYNAMITE ENTERTAINMENT |
2.44% |
2.71% |
|
BOOM! STUDIOS |
2.28% |
1.94% |
|
VIZ MEDIA |
1.30% |
0.63% |
|
EAGLEMOSS PUBLICATIONS LTD |
1.05% |
0.28% |
|
RANDOM HOUSE |
0.74% |
0.21% |
|
OTHER NON-TOP 10 |
9.30% |
5.61% |
COMPARATIVE SALES STATISTICS
|
|
DOLLARS |
UNITS |
|
OCTOBER 2010 VS. SEPTEMBER 2010 |
||
|
COMICS |
-6.96% |
-7.42% |
|
GRAPHIC NOVELS |
-13.37% |
-1.76% |
|
TOTAL COMICS/GN |
-9.20% |
-6.89% |
|
OCTOBER 2010 VS. OCTOBER 2009 |
||
|
COMICS |
-1.70% |
-5.26% |
|
GRAPHIC NOVELS |
13.04% |
29.05% |
|
TOTAL COMICS/GN |
2.77% |
-2.70% |
|
YEAR-TO-DATE 2010 VS. YEAR-TO-DATE 2009 |
||
|
COMICS |
-4.82% |
-6.05% |
|
GRAPHIC NOVELS |
-4.56% |
-5.97% |
|
TOTAL COMICS/GN |
-4.74% |
-6.04% |
TOP 10 COMICS
|
DESCRIPTION |
PRICE |
ITEM CODE |
VENDOR |
|
|
1 |
UNCANNY X-FORCE #1 |
$3.99 |
AUG100524-M |
MAR |
|
2 |
BATMAN: THE RETURN OF BRUCE WAYNE #5 |
$3.99 |
JUN100157-M |
DC |
|
3 |
BRIGHTEST DAY #11 |
$2.99 |
AUG100111-M |
DC |
|
4 |
BRIGHTEST DAY #12 |
$2.99 |
AUG100113-M |
DC |
|
5 |
GREEN LANTERN #58 |
$2.99 |
JUL100114-M |
DC |
|
6 |
BATMAN AND ROBIN #15 |
$2.99 |
JUN100155-M |
DC |
|
7 |
NEW AVENGERS #5 |
$3.99 |
AUG100566-M |
MAR |
|
8 |
AVENGERS #6 |
$3.99 |
AUG100562 |
MAR |
|
9 |
SECRET AVENGERS #6 |
$3.99 |
AUG100563-M |
MAR |
|
10 |
KICK-ASS 2 #1 (MR) |
$2.99 |
JUN100640-M |
MAR |
TOP 10 GRAPHIC NOVELS & TRADE PAPERBACKS
|
RANK |
DESCRIPTION |
PRICE |
ITEM CODE |
VENDOR |
|
1 |
SUPERMAN: EARTH ONE HC |
$19.99 |
JUN100127 |
DC |
|
2 |
THE WALKING DEAD VOLUME 1: DAYS GONE BYE TP |
$9.99 |
JUL068351 |
IMA |
|
3 |
RICHARD STARK’S PARKER: THE OUTFIT HC |
$24.99 |
AUG100301 |
IDW |
|
4 |
THE WALKING DEAD VOLUME 2: MILES BEHIND US TP |
$14.99 |
SEP088204-M |
IMA |
|
5 |
BUFFY THE VAMPIRE SLAYER SEASON 8 VOLUME 7: TWILIGHT (MR) |
$16.99 |
JUN100044 |
DAR |
|
6 |
THE WALKING DEAD VOLUME 3: SAFETY BEHIND BARS TP |
$14.99 |
NOV082245 |
IMA |
|
7 |
THE WALKING DEAD VOLUME 4: HEARTS DESIRE TP |
$14.99 |
SEP088205-M |
IMA |
|
8 |
HELLBOY VOLUME 11: MASKS AND MONSTERS TP |
$17.99 |
JUN100038 |
DAR |
|
9 |
NARUTO VOLUME 49 TP |
$9.99 |
JUL101178 |
VIZ |
|
10 |
THE WALKING DEAD VOLUME 6 HC (MR) |
$34.99 |
AUG100383 |
IMA |
 <
<


Eaglemoss?
Ah… they’re the English “partwork publisher”, publishing magazines which come packaged with statues or model parts.
Wow… even with Scott Pilgrim, Oni did not crack the Top Ten. (Oh, right, this is comics AND graphic novels. But Eaglemoss did?)
Also, Walking Dead has been a consistent backlist seller, which each new volume charting high, and the older volumes selling enough copies each month to make the list.
(In September, WD charted at:
6, 8, 14, 20, 24, 28, 31, 38, 40, 46, 47, 49, 50, 152, 196, 198, 236)
Those lower volumes, those are the $35 hardcovers which still sell about 500 copies a month.
I wonder how this compares with the Diamond Book side of their business, now that Marvel is gone. I would asssume that sales in that division would have to be down by at least 40-50%.
Looking at Brian Hibbs’ BookScan numbers for 2009, I don’t know if the hit would be that severe, as Marvel’s sales in bookstores is a bit weak (and Amazon might be ordering from Diamond Comics). Five of the Top Ten publishers are DBD clients (Image, Dark Horse, Dynamite, Boom, IDW).
If my math is correct, these numbers tell us that in terms of dollars, Diamond’s graphic novel business in October 2009 was 5.6x greater than its comics business.
In October 2010, in terms of dollars, Diamond sold 5.2x more graphic novels than comics.
I’m pretty sure my 2010 calculation is off… but that my Oct 2009 number is good.
I’ve recrunched the Oct ’10 numbers, and now I get gn dollars in Oct ’10 as 6.5x greater than comic dollars.
I think that makes more sense than my previous calculation.
“Marvel led DC in units and dollars once again, and perhaps most notably — the #1 comic this month is by Rick Remender and Jerome Opeña — hardly household names but maybe they should be.”
I love Rick Remender and Jerome Opena, but let’s face it: an X-book that heavily promoted featuring such an all star cast (including Wolverine AND Deadpool) with a bunch of variants…it could have been written by a goldfish and drawn by an octopus and it’d still have been #1 first month.
That’s not to say that creator strength doesn’t help books like that, but that they help them stay on the upper end rather than starting them there. Johns, Bendis, and Morrison are good examples of this, and even then only hit top numbers with big franchises in premiere storylines.
Not to slight the creators or their work here. Love them, love the book, and I hope it stays successful. I just think it’s position at #1 likely has very little to do with them. If it stays as a top 10 title, then we’re talking.
Percentages-wise, that’s a big drop-off for Marvel.
OK, this is my *final* answer, and it fits other calculated Diamond numbers a lot better…
Unit sales:
Oct ’09: graphic novel units are 8% of comics units
(comics shipped 12.2x more units than graphic novels)
Oct ’10: graphic novel units are 11% of comics units
(comics shipped 9.1x more units than graphic novels)
Dollar sales:
Oct ’09: graphic novels are 52% of comics
(comics gross 1.9x graphic novels)
Oct ’10: graphic novels are 49% of comics
(comics gross 2.0x graphic novels)
There’s a little bit of rounding in there, but these figures make a lot more sense with ICv2’s calculated units for comics shipped and for graphic novels shipped. (The numbers for individual gn’s are always a lot lower than the numbers for individual comic issues, a fact that my original calculation didn’t agree with… so it had to be incorrect. *blush*)
Note that the dollar sales for comics relative to gn’s isn’t very different when comparing the two months.
So even though the total floppies shipped in Oct ’10 went down by more than 5% as compared to Oct ’09 *and* the number of gn’s shipped in Oct ’10 was 29% higher than in Oct ’09, the dollar sales for comics relative to gn’s didn’t move very much at all. That tells us that the higher cover prices on floppies in Oct ’10 vs. Oct ’09 was enough to not only offset the 5% decrease in units shipped but *also* keep pace with the 29% increase in gn units at the same time.
Wow! *Somebody* out there is purchasing $3.99 floppies.
In October 2009, Diamond’s Top 300 comics had dollar sales of $21.48 million — and Diamond’s Overall Comics, Magazines, and Trade Paperback sales (including long tails for everything) totaled around $34.18 million. If you figure the Comics number as likely closer to $23 million with everything accounted for, then, yes, comics would have grossed close to double what trades did, as you’ve said.
As I say on my site, TPB units aren’t always a useful metric, because the average cost per unit varies wildly from month to month — wobbling around in a $2 range this year. But on the whole, this is a very important addition to the data we get every month — it goes a long way to resolving the problems we were seeing with the Top 300s not capturing everything.