I
ICv2 has its September estimate up but nothing is normal as returnable books were penalized 10%. DC’s cheaper cover price meant that their dollar share was up only a bit over Marvel, but units sold convincingly better.
The strong sales of the “New 52” helped push September sales up strongly and give DC its first market share victory over Marvel in years (see “DC Wins September Market Share”). DC dominated the “Top 25” with a record 19 titles versus just 6 for Marvel. In view of the “Top 25,” Marvel’s near parity with DC in dollar market share testifies to the overall strength of Marvel’s lineup as well as to the House of Idea’s higher cover prices. There is also some evidence for the “rising tide lifts all boats” theory in the fact that, in spite of the obvious success of DC’s “New 52,” all four of the Marvel titles in the top 25 that were not number one issues, all posted circulation gains over August. With DC’s entire September lineup composed of number ones, it is difficult to provide comparisons, though it should be noted that in the “Top 25” the new DC #1s all outsold the previous issues of the comics with the same title.
However, the big underreported story for September is the dip in GN sales. Is it just the SCOTT PILGRIM effect?
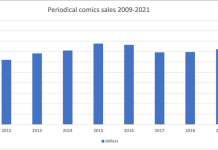
As they were in August, comic sales were up year over year, with an 8.37% dollar increase over September 2010. Graphic novel sales were very weak, down 18.44% vs. the previous year. That left the total for comics and graphic novels still negative, down around 1% vs. sales in September 2010.
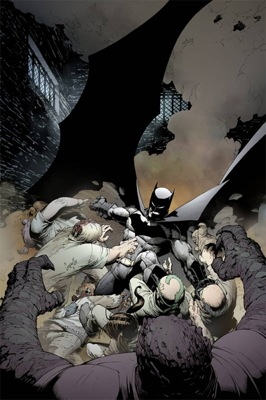
ICv2 – ‘Batman’ #1 Tops September Sales
188,420 Batman #1182,748 Action Comics #1141,682 Green Lantern #1129,260 Flash #1118,376 Superman #1*103,392 Detective Comics #1*98,389 Batman: The Dark Knight #1*93,032 Fear Itself #687,237 Ultimate Spider-Man #185,242 Batman & Robin #1*84,033 Green Lantern: New Guardians #181,489 Batgirl #1*76,214 Wonder Woman #174,769 Green Lantern Corps #1*73,675 Teen Titans #172,272 Aquaman #1*72,228 Batwoman #171,944 Amazing Spider-Man #66966,546 Red Lanterns #1*62,856 Justice League Dark #1*62,717 Nightwing #1*62,080 Ultimate Comics X-Men #161,492 Avengers #1761,079 Justice League International #1*58,326 Uncanny X-Men #543
MORE: Top 300 Comics Actual–September 2011.
Top 300 Graphic Novels Actual–September 2011



So bottom line is sales were down 1% over a year ago.
It looks like the available pool of dollars just shifted towards the “New” 52 books, probably out of curiosity.
What ever the case, the picture will be clear in three or four months.
It’ll be a couple of months before we get anything meaningful from the New 52 sales figures, but this looks like a good start for them.
Poor OMAC came 52nd out of 52, but it’ll be interesting to see if it moves up the rankings in future months – that and Static Shock are really great comics that I would expect to be more successful in attracting new readers than a lot of the others.
If the graphic novel sales for September is just counting new graphic novels then I can see how this category would be down from last year, but what about graphic novel sales as a whole for September (meaning reorders of evergreen books like Walking Dead, Alan Moore books, and Marvel Zombies)?
“That left the total for comics and graphic novels still negative, down around 1% vs. sales in September 2010.”
In light of the massive PR push the industry just got, this is a very bad sign.
. . . what is the SCOTT PILGRIM effect?
Ralph, the GN figures include reorders of back catalog.
Kevin, I believe The Beat is suggesting that Scott Pilgrim’s brisk sales a year ago boosted the year-ago numbers used here for comparison. If so, that’s a little misleading. Here are the Sept. 2010 GN charts:
http://www.diamondcomics.com/public/default.asp?t=1&m=1&c=3&s=816&ai=101139&ssd=
Sure, lots of Scott Pilgrim, but also a lot of Walking Dead and licensed Dark Horse books (e.g., Dr. Horrible and Star Wars). It looks like TV/movie tie-in stuff was very strong a year ago but isn’t so prominent on the Sept. 2011 chart. The new Castle GN at #4 is the major exception.
Scott Pilgrim only charted at #5 in September 2010. So that doesn’t really apply.
Top Ten comparison:
2010
50,778 units sold
$834,365.22
2011
54,448 units sold
$1,111,478.52
2010 #300 = $14.99 444
2011 #300 = $24.99 296
2010 362,547 units $7,032,242.37
2011 313,384 units$6,381,307.52
But Torsten, note that there were (…counting quickly….) six volumes of Scott Pilgrim and 13 Walking Dead books in the top 50 GNs from Sept. 2010. That included the $60 Walking Dead Compendium at #20.
I agree that the “Scott Pilgrim Effect” wasn’t as strong as implied in the original post, but the O’Malley-Kirkman pair certainly boosted GNs considerably a year ago.
The “long tail” did do worse, as I wrote here:
http://blog.comichron.com/2011/10/september-2011-comics-sales-estimates.html
The Top 300 trades were off 9% in dollars versus last September’s Top 300, but when the rest of the “long tail” is added, the shortfall doubles to 18.44%.
I squared up the two September charts for comparison and found that dollar-wise, 2011 was doing better cumulatively from 1st to 39th place; after that, 2010 led for the rest of the way.
The weighted average price for Top 300 trades in September 2011 was $20.36 versus $19.40 last September — this is partially related to the volume on the smaller-ticket Pilgrim and Walking Dead books. Another curiosity: there were 94 new trade paperbacks in September 2011 — that is, solicited in July — versus only 68 in September 2010.
The number of DC and Marvel books in the two charts is pretty close to the same in each year, both in the 60s.
The charts with numbers, for comparison, are here and here:
http://www.comichron.com/monthlycomicssales/2010/2010-09.html
http://www.comichron.com/monthlycomicssales/2011/2011-09.html
“…there were 94 new trade paperbacks in September 2011 — that is, solicited in July — versus only 68 in September 2010.”
That made the Top 300, I meant to say.
I always thought September was back to school month for kids, teens and college students and since college kids need to buy school books, supplies, etc. money for other things is generally down. If parents are buying them for their teens and kids I can see a parent spending their money on school stuff this month.
In the 1980s, September was usually a horrible month in comics for exactly that reason, Keyser. “Black September” was a phrase frequently used in the trade press — Malibu used the name later on for a promotion. It was always kind of an unfortunate term, given the infamous terrorist group by that name.
But Septembers in the last decade have been rather strong. Part of that’s a reflection of who’s buying the comics, but I think the summer convention season’s role as a launch platform has a lot to do with it.
So the Comics Industry is hoping that the “new, lapsed/returning” readers lured in by the DCnU Reboot… will hang around and buy GNs in the next year to offset that -18.44% loss and
make up for that -1% Total Sales differential?
Good luck.
Could also be how retailers distributed their available money — shifting it towards DCnU relaunch, and skimmed a bit on trades here and there.
Hmm.. the article states: “all four of the Marvel titles in the top 25 that were not number one issues, all posted circulation gains over August. ”
and yet, the second Marvel title in the line up is ULTIMATE SPIDER-MAN #1….
i’m an idiot, nor can I read. ha ha. sorry, kids
I’m not an expert and can only speak for myself, but I’m mainly a trade-reader.
The reason I, personally, buy less is that with the rise to 3.99 monthlies, the trades also became more expensive.
It used to be 15 bucks for 6 issues – now it’s often 20 bucks, or for example, X-Force collects 4 issues plus change for 20 bucks!
My stores saw September increase well above this 1% number. The Scott Pilgrim effect definitely is an issue, however, I think one factor not yet mentioned is store closings.
Besides the well-known Atomic, at least another chain in the midwest went under, and I’m willing to wager those are not the only stores to have gone under in August. When a store goes under, most of its customer base goes with it, so I would not be surprised if that played a roll.
Finally, these numbers are based off initial order and print runs and do not include multiple printings. I imagine when October numbers hit, and second prints are factored in, the numbers will grow a good deal on the New 52.
Oh….and don’t forget that 10-20% returnability adjustment built into the numbers….