 By John Jackson Miller
[reprinted with permission from Comichron.]
October smashed all comics records from the last decade-plus again, with a thousand new comic books, graphic novels, and magazines hitting the market. Based on Comichron’s analysis of data released by Diamond Comic Distributors, comics shops in North America ordered more than $56 million in printed product during the month. Seven comic books had orders of more than 100,000 copies. Click to see the sales estimates for comics ordered in October 2014.
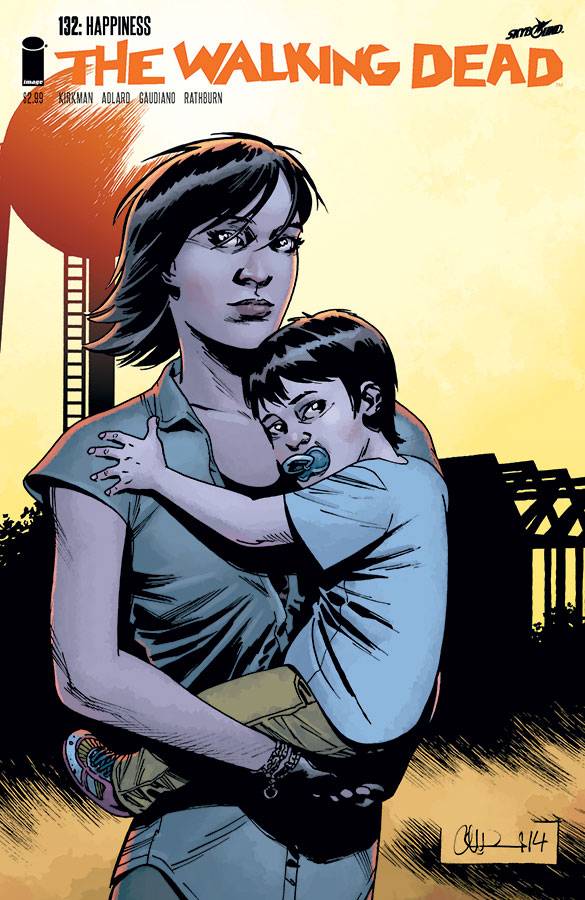
Highlights of the month included Diamond’s Halloween ComicFest, its fall counterpart to Free Comic Book Day — and topping the charts again, we have a comic book whose sales were greatly inflated by a single order from the pop culture subscription club, Loot Crate. Image’s Walking Dead #132 far outdistanced other comic books offered in October, with estimated orders of more than 326,000 copies.
The question is, how many of those copies did Loot Crate order? There’s no way to know for sure — and no reason to expect that Diamond would reveal the ordering levels of one of its customer accounts. But unlike Rocket Raccoon #1, this issue of Walking Dead was in the middle of a series — and as such, the issues around it serve as clues. Issue #131 in September had first-month estimated sales of 69,810 copies; issue #133, which also came out in October, ranked 16th with orders of 69,561 copies.
That suggests a floor for #132 in the Direct Market of nearly 70,000 copies — meaning however many copies Loot Crate purchased, it could not have been more than 256,000. How many fewer? While theWalking Dead fifth season did premiere on TV on Oct. 12, eleven days after the release of #132, it doesn’t seem from the solicitation materials that the particular issue was the target of special attention. Diamond shipping records indicate no variant editions for the Direct Market. So while I had suggested here on Friday that the comic book could have topped the charts without Loot Crate’s help, seeing the numbers suggests that’s less likely. It could be possible, in fact, that Loot Crate ordered a quarter million copies of the issue.
Earlier in the year, Rocket Raccoon dropped 237,000 copies from its first Loot Crate-ordered issue to the next, but it would’ve dropped some part of that because of the difference between first- and second-issue sales. Loot Crate offers orders of specific individual bundles in addition to its subscriptions, so there could well be significant volatility from order to order. We need more data points to get a better gauge, but we are almost certainly in the peculiar situation of a variant, the Loot Crate labeled edition, being more numerous than the regular Direct Market version.
All this raises the question of whether such colossal orders are being reported in the right place. Yes, Diamond is selling the books nonreturnably to Loot Crate, just as it does copies of other variant comics produced for mail-order houses — though none of them, to my knowledge, have ordered more copies than the entire Direct Market bought of a comic book. Does it make a difference if these orders are reported with the regular monthly data? It really depends on your point of view.
Certainly the publisher with the Loot Crate deal benefits by having the orders reported in the same place, while all the other publishers who might have vied for first place do not. While the importance of its suppliers’ views are obvious, however, the target audience of distributor sales charts has always been retailers, looking to see what other shops are having success with and using the Order Index numbers to adjust their purchase numbers. The figures for Loot Crate-enhanced titles are thus basically useless for such a purpose, although they may tip shop-owners off that a bunch of new people have been introduced to the title.
There’s no similar gap on the graphic novel side of things; we see from the numbers that Ms. Marvel Vol. 1 topped the graphic novel charts with first-month orders of about 7,795 copies, surpassing the #2 title by a couple of cases.
RECORDS: There was, of course, the main record broken: the highest dollar value for comics, graphic novels, and magazines ordered in the Diamond Exclusive era, at $56.09 million. That’s double the total for ten years earlier, October 2004.
But other records were set. Retailers ordered 8.41 million copies of the Top 300 comics, the highest number since December 1997, when Darkness #11 led the market. The Top 300 comics were valued at $31.94 million, the highest figure seen in the period. Image’s unit sales in that grouping — again, boosted by Loot Crate — were its highest since April 2000 when Fathom was atop the charts, and Image’s dollar sales in the Top 300 were at the highest level since July 1998.
Retailers ordered $40.76 million of the Top 300 comics and the Top 300 graphic novels, the highest figure for that category in the Diamond Era. Marvel’s sales in that grouping were also its highest in the era.
The aggregate changes:
October 2014: 8.41 million copies
Versus 1 year ago this month: +8%
Versus 5 years ago this month: +36%
Versus 10 years ago this month: +42%
Versus 15 years ago this month: +30%
YEAR TO DATE: 69.17 million copies, -3% vs. 2013, +11% vs. 2009, +13% vs. 2004, +7 vs. 1999
ALL COMICS UNIT SALES
October 2014 versus one year ago this month: +10.14%
YEAR TO DATE: -0.66%
—
October 2014: $31.94 million
Versus 1 year ago this month: +10%
Versus 5 years ago this month: +49%
Versus 10 years ago this month: +87%
Versus 15 years ago this month: +84%
YEAR TO DATE: $262.38 million, +1% vs. 2013, +23% vs. 2009, +49% vs. 2004, +57% vs. 1999
ALL COMICS DOLLAR SALES
October 2014 versus one year ago this month: +10.84%
YEAR TO DATE: +3.64%
—
October 2014: $8.82 million
Versus 1 year ago this month: +6%
Versus 5 years ago this month: -9%
Versus 10 years ago this month, just the Top 100 vs. the Top 100: +24%
Versus 15 years ago this month, just the Top 25 vs. the Top 25: 13%
YEAR TO DATE: $73.51 million, -3% vs. 2013
ALL TRADE PAPERBACK SALES
October 2014 versus one year ago this month: +12.9%
YEAR TO DATE: +5.31%
—
October 2014: $40.76 million
Versus 1 year ago this month: +9%
Versus 5 years ago this month: +36%
Versus 10 years ago this month, counting just the Top 100 TPBs: +60%
Versus 15 years ago this month, counting just the Top 25 TPBs: +98%
YEAR TO DATE: $335.88 million, unchanged vs. 2013
ALL COMICS AND TRADE PAPERBACK SALES
October 2014 versus one year ago this month: +11.46%
YEAR TO DATE: +4.15%
—
October 2014: approximately $56.09 million (subject to revision)
Versus 1 year ago this month: +11%
Versus 5 years ago this month: +64%
Versus 10 years ago this month: +101%
YEAR TO DATE: $451.19 million, +4% vs. 2013
RELEASES
New comic books released: 590
New graphic novels released: 374
New magazines released: 55
All new releases: 1,019
The average comic book in the Top 300 cost $3.75; the average comic book retailers ordered cost $3.80. The median and most common price for comics offered was $3.99. Click to see comics prices across time.
As mentioned Friday, Comichron projects the comic shop market will complete the year with orders totaling around $535-540 million; the smaller figure is reached if November and December are completely flat, the larger if sales are up 5%. Either one would bring the year-to-year increase to around 4%, the smallest year-to-year gain of the three up years. “Gravy Day” — the point after which any new sales are an increase over last year’s sum — should fall in the second week of December this year.
That’s it for October’s report. I’ll be speaking about the comics market in panels this weekend atAtomacon in N. Charleston, S. Carolina, and the weekend of Nov. 21-23 at Memphis Comic and Fantasy Con. Hope to see you there — and wherever you are, you can find your local comic shop here.
John Jackson Miller has tracked the comics industry for more than 20 years, including a decade editing the industry’s retail trade magazine; he is the author of several guides to comics, as well as more than a hundred comic books for various franchises. He is the author of several bestselling novels including Star Wars: Kenobi and the recently released Star Wars: A New Dawn. Visit his fiction site athttp://www.farawaypress.com. And be sure to follow Comichron on Twitter and Facebook!



Comments are closed.