Tag: dc sales charts
DC Comics Month-to-Month Sales: December 2017 – No Tears for Batman
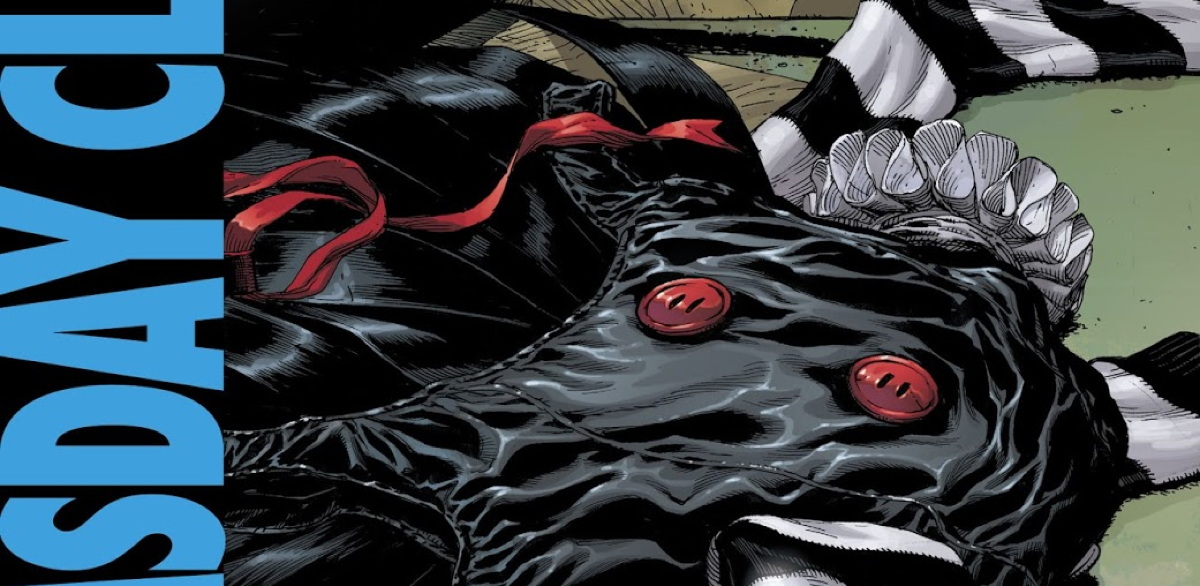
The biggest surprise in the December Diamond-NA comics chart is not that DC has five of the top six comics (and six of the top ten), or that DC & Marvel are in a virtual tie for market share (DC edges out Marvel for dollar share, while Marvel edges out DC for unit share), or even that DC is maintaining strong sales of both Dark Nights Metal & Doomsday Clock.
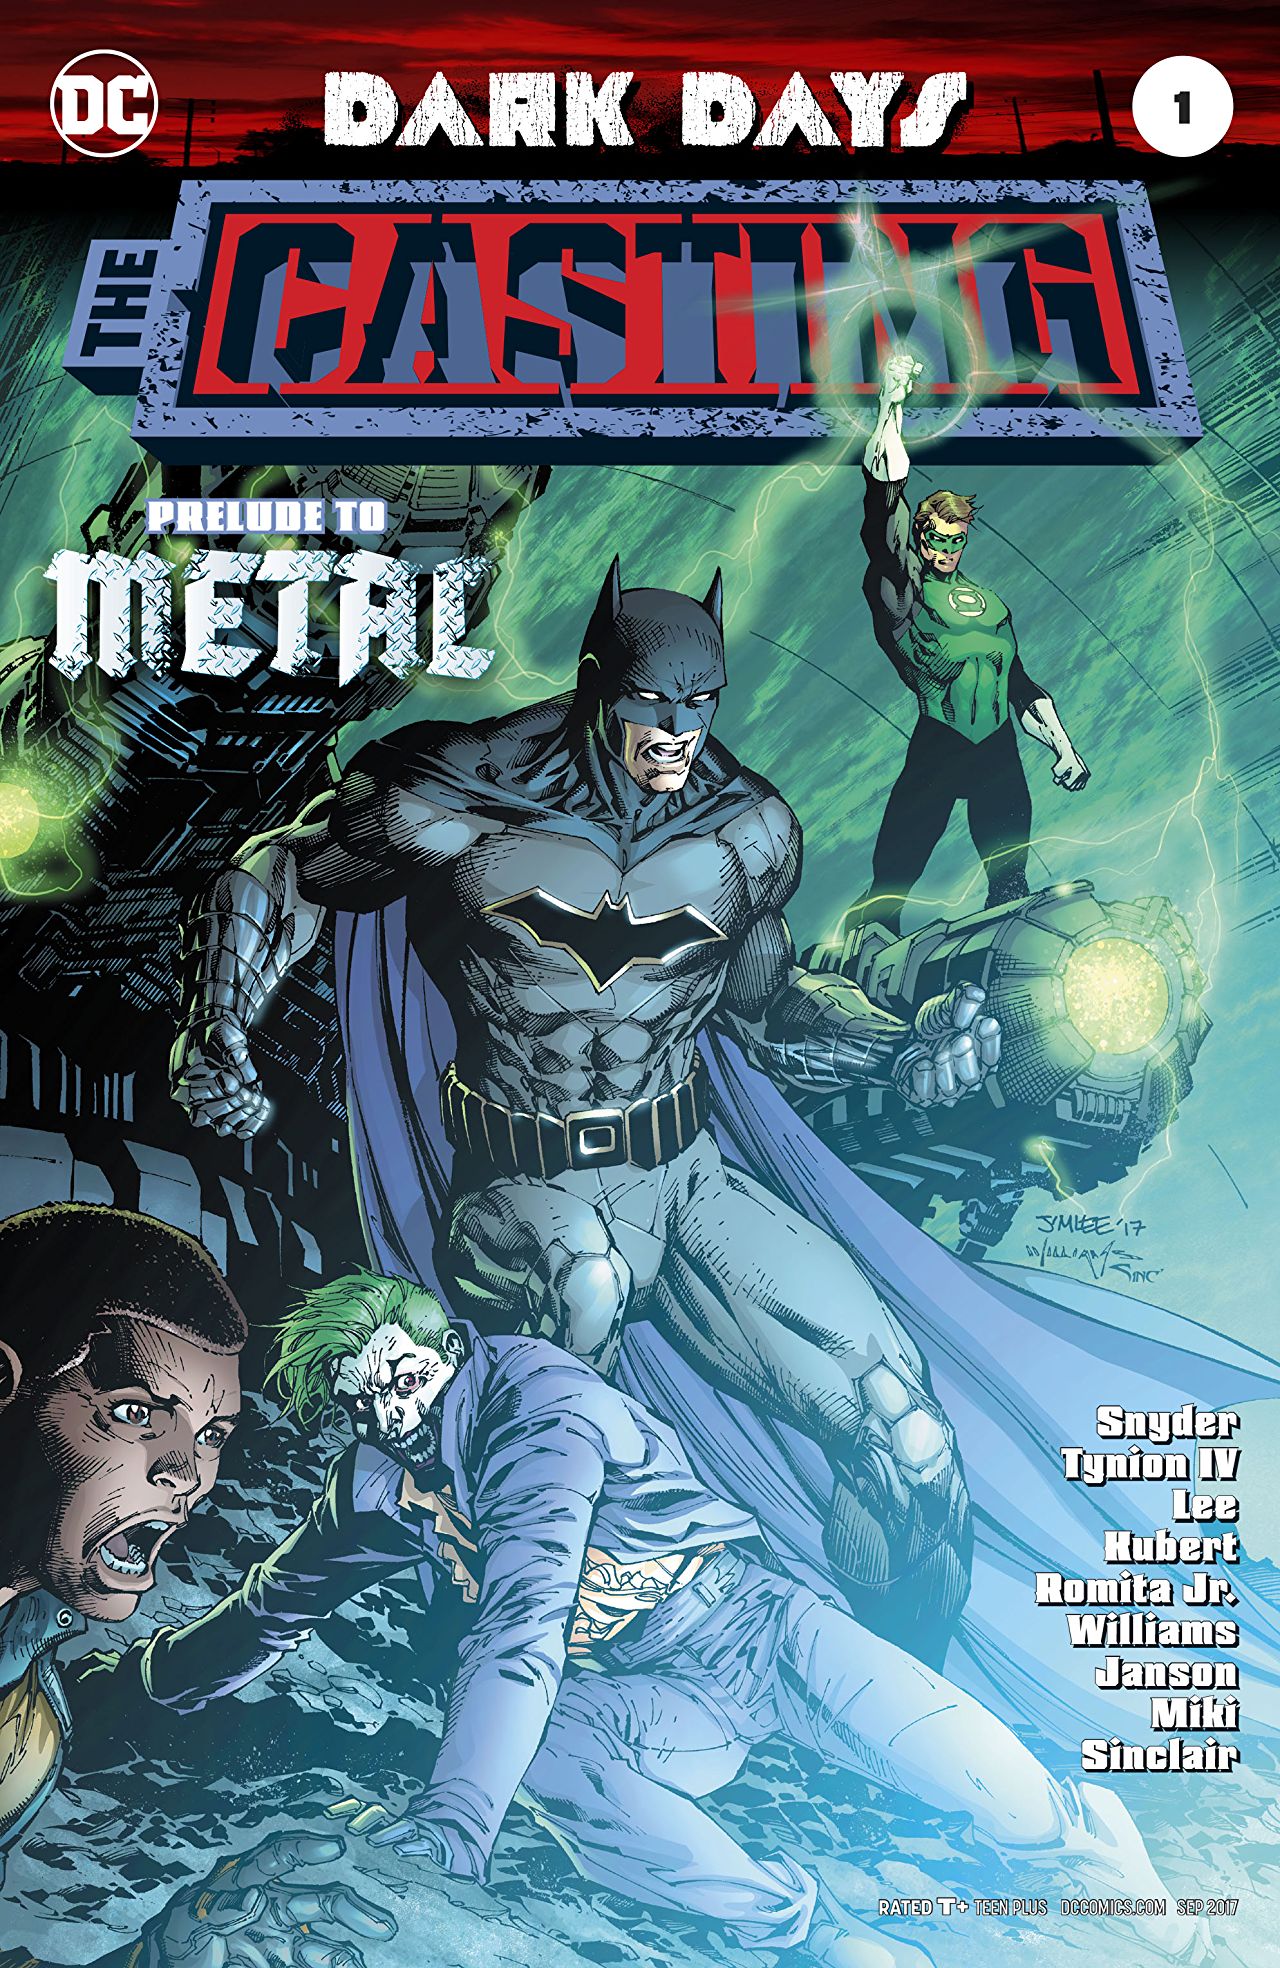
DC Comics Month-to Month Sales: July 2017 – The Die is Cast
Greetings, sales charts fans! It's time once again to look at DC's sales figures.
Many have noticed that DC have yet, a year in, to cancel any of their Rebirth series. Contrast this to the...
DC Comics Month-to Month Sales: February 2017 – Saga of the Super Sons
Greetings, sales charts fans! It's time once again to look at DC's sales figures.
DC moved a total of 2.66 million comics through Diamond-NA in February over 82 different titles, down about 200K from the previous month (on two fewer titles), and more than 750K more than February 2016.
DC Comics Month-to Month Sales: August 2015 – Bombshells Return
Greetings, sales charts fans! It's time once again to look at DC's sales figures.
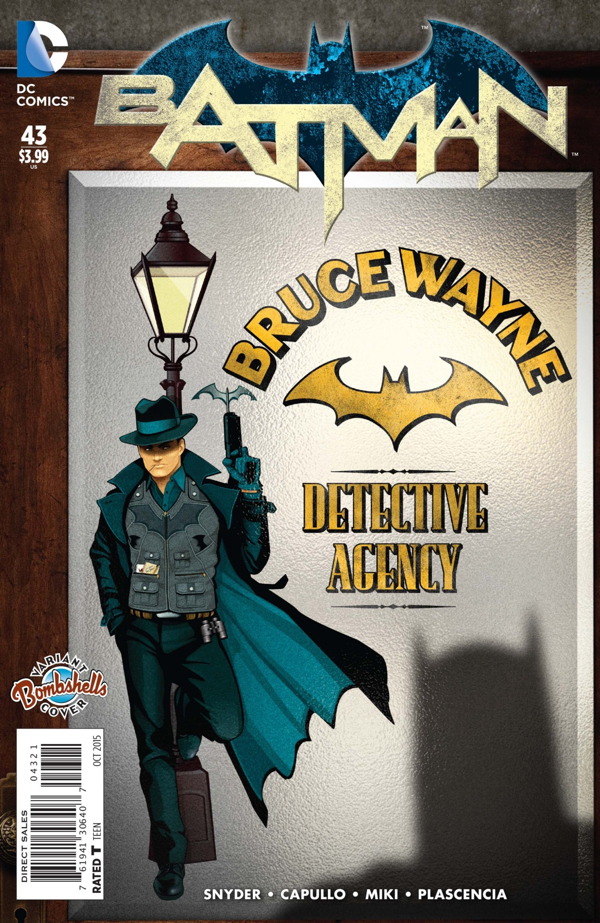
Back in June 2014, DC kicked off their freely-orderable variant (f.o.v.) cover program (or as DC has taken to calling them, open-to-order variants) with Bombshell variants with covers by Ant Lucia that evoked pin-up art from the 1940s. It was a big success, with the comics sporting them seeing huge gains and has spun off into a line of statues. So it makes sense that DC would want to return to the Bombshells theme, and this month sees a batch of all-new Bombshells covers as well as the launch of a DC Comics Bombshells comic (reprinting the digital-first comic of the same name). It's a moderate success this time out, especially compared to last month's Teen Titans Go! variants (all of those sporting both variants see a jump up in sales this time out), and the comic itself sells very well for a digital-first comic. While we can be fairly sure that the f.o.v.s are giving a boost beyond the natural sales level for titles bearing them, it is clear that the size of that boost is greatly dependent on the demand for that month's theme (or rather the perceived demand by retailers, which as in all cases on these charts has to stand in for actual consumer demand).
DC Comics Month-to Month Sales: September 2014 – 3D Motion Sickness
by David Carter
Greetings, sales charts fans! It's time once again to look at DC's sales figures.
As has been their wont for the past few years, DC marks the September anniversary of The New 52 with a publishing stunt. In September 2012 it was Zero Issues; in September 2013 it was Villains Month with fancy 3D covers, weird X.1 numbering, and allocations. And in September 2014 they return to the 3D cover well with Futures End one-shots.
This year DC avoided last year's allocation falderal by having retailers get their orders for the Futures End one-shots in a couple of months early, with creative teams announced only a couple of weeks before orders were due, and initial orders only (no Final Order Cutoff). (Retailers were also allowed to order up front as many 3D and standard covers that they wished for each title.) This caused no end of problems for retailers as they had to judge how many to order of these one-shots with no real clue as to how they would sell. Would there be as much demand as there was last year with the highly-publicized 3D cover shortages? How many customers would want to get the fact 3D covers, regardless of whether they were buying the regular titles? How many customers would want 3D covers over standard covers? How many customers would just sit out the one-shots all together?
